
The Crooked Timber of American Public Opinion
An Exploration of Nationscape Survey Dataset for NYC & Seattle C.D.'s

“Out of the crooked timber of humanity, no straight thing was ever made.” — Immanuel Kant.
[Note: Below is a meandering reflection. Feel free to skip to next section, where body of the post starts.]
Occasionally, I stumble upon a chart so fascinating that I have to scrutinize it further. And when I follow the source data and I have to make a decision do I want to spend many hours exploring the patterns in this data or is it something that can be safely left alone? I told Jeremy Wallace that for me data analysis is like reading books—with many hours wasted away without firmly grasping many of the impressions from the screens and pages. During these reflections, my thoughts drift to Ralph Waldo Emerson, I added, “I cannot remember the books I’ve read [datasets I’ve analyzed] any more than the meals I’ve eaten; even so, they’ve made me.” Other bloggers and sharp analysts, including Tanner Greer and Jonathan Sine, have similarly reflected on the problem of retention. I gently suggested to Greer on Twitter that I was surprised for him to be so concerned, as disorienting as the experience of revisiting books you thought you had internalized decades ago can often be. Unlike Greer, I have never spent serious time with the classical Chinese texts of Zhuangzi and Xunzi, but the message of struggling to maintain some semblance of authentic self amidst the glut of information is impossible to be lost on the contemporary reader. The key idea on the unity of the heart-mind is worth quoting:
[the heart-mind]…has three cardinal attributes: “emptiness” (xu 虛) “unity” (yi 壹), and “tranquility” (jing 靜)….denote three nurturable faculties that we all possess from birth, but do not employ to the same degree… ‘resolving blindness’ self-destructive acts…because we fail to employ our heart-minds correctly…“Emptiness” refers to the heart-mind’s ability to store a seemingly unlimited amount of information: we do not have to erase one datum in order to make room for another. “Unity” refers to the heart-mind’s ability to synthesize diverse data into meaningful paradigms. And “tranquility” refers to the heart-mind’s ability to distinguish fantasy from rational thinking. Armed with these powers, we can infer the patterns of the Way by taking in, and then pondering, the data transmitted to the heart-mind by the senses.
I cannot be sure if Dominik Leusder has a direct interest in Chinese philosophy, or if it is yet another instance of similar insights alchemized from different substances, but it is very much in this spirit that he said in an interview a while back that the most attractive quality of navigators of polycrisis is a “unity of purpose”.
I fear that, like Greer, I am failing to understand these ancient insights due to the pressures of co-production in the knowledge economy that demand information to be in constant control. Ephemerality eluding one’s grasp is a message that is primed to resonate in Daoist mountain retreats, not the structured offices introduced by the advent of mass consumer society, discussed in Levy’s Ages of American Capitalism (we’ll return to this point—this post on American public opinion is in part on the long shadow of the counterculture). So in some sense, the data analysis exercise that I am about to do now is anathema to the Daoist spirit, of meditative introspection. I have not “resolved blindness” because I am beholden to these pressures.
But I don’t believe wisdom can be purely reduced to meditative self-introspection. I’ve adopted Laozi’s line as a personal motto, “production without possession, serving without self-assertion, and development without domination.” This set of three agendas is what I set out to do when I created this newsletter. In other words, the opposite from the academic publishing business with knowledge stowed away in walled gardens at exorbitant rates that serves nobody’s interests. Contrast that model, among the most perverse insular vanguards, also with the inclusive vanguard aspirations of the data science professions, which are increasingly leaving incredibly rich datasets widely available. Inclusive vanguardism, of course, is a challenge, as they are often not de facto accessible when they are released to communities lacking the tacit knowledge that produced them.
Education as a Democratic and democratic Bulwark
The chart that I referred to at the beginning was this one, demonstrating the variation in U.S. congressional districts by social and economic ideology scores from a New America report. Just an incredibly rich chart. When reading charts, my UCSD macro professor instructed pointing to U.S. GDP growth over the last 100 years and change, there are two equally valid interpretations—(1) the baseline story of compound growth (2) punctuated by periodic sharp downturns. I like to think of this chart as the political science equivalent. Serious political thinkers, Ted Fertik among them, fixate on the shifting involvements of partisan competition and the political strategies needed to cohere party coalitions, just as their colleagues across the hall at their best devote their thinking to efforts directed at sustaining the magic of compound growth.
However, if your natural inclinations call you to the corners or deviations from trend, you must of course explicitly acknowledge that you are digressing from the main event, but those digressions serve a purpose. I am of the second splitting type as interested in The Great Awokening as the Great Financial Crisis:

I developed a hypothesis that the red cluster also contains the most educated districts in the U.S. In reality, only two of these districts are among the 15 most educated. The actual orientation of the 15 most educated districts, the base of the Democratic coalition, reveals substantially more ideological variance than I assumed. The pressures facing the GOP coalition are not exceptional.

What is exceptional to the Democratic coalition is that it lacks the need to overcome the spread. My theory that education drives liberalism is, I think, on the mark if the aim of the education received by professionals in these districts was to develop a political philosophy. In a world of scarce attention and self-interest, that tragically is a counterfactual we do not inhabit and therefore untestable. The actual mechanism behind the megatrend of education as a bulwark (and Achille’s heel elsewhere) of Democratic advantage in these bastions of expert power is college attainment is omitted in the chart’s schema not primarily endogenous to ideological orientation.
The districts on the right should vote Republican—and did not too long ago—but over the years they have fallen like dominoes. First, starting with the districts at the axis, then moving slowly rightward, including the GA-06 race, boundaries that are now as a result of the most recent redistricting solidly in the Democratic column. By the hopeful Democratic account, that race was simply the future seen on the periphery with Georgia, a state of the solid south, represented by the battle-tested Ossoff in the Senate.1 Along with Sen. Warnock, those 2021 victories tipping the balance of the Senate cannot be overstated as a return, but more significantly as a reversal. The decades-long preference of the educated for Republicans had seen the final domino fall.
With the zones of engagement expanding on the economic dimension, the less hopeful narrative is the reverse of the one currently staring down GOP operatives since the emerging rift within the Democratic coalition is on social issues. To explore further, let’s follow the source data, the Nationscape Democracy Fund-UCLA survey dataset, for two data points on opposing sides of this potential rift, WA-07, the overall most liberal congressional district, of Seattle represented by Pramila Jayapal, and NY-10 of Brooklyn and Lower Manhattan (Wall St dot above), an area to the outside observer with ironclad progressive credentials. But why again does New York City reliably find characters like Rudy Giuliani and Eric Adams endearing? What is the disaggregation of the NY-10 social ideology score, which is approximately equivalent to the suburban Republican district peppered in metros across the country? Surely, it can’t mean NY-10 preferences are across the board identical to those cookie cutter districts, because very different kinds of people with diametrically opposed psychology profiles have been sorted into them.
The NY districts (NY-10 and Manhattan just below it) also further complicate any simplistic theories I may have mistakenly articulated that education drives liberal ideological preferences. As suggested by the contrast with the Left Coast counterculture roots, political ideology can be explained only through the empirical cop-out of “culture”. Ideology as explained on the protean terms of George Lakoff’s neoliberalism is helpful as to ascertaining the difference. Instilling a paternal discipline to prepare for the rigors of the market or cultivating free-expression in the open-ended pursuit of enlightenment on terms Xunzi would have recognized? Cities that look outwardly the same to the untrained eye come to terms with this question differently, and is manifested in a limited way by opinion polling. Consistent with Gary Gerstle’s narrative, critically, both the Neo-Victorian and new cosmopolitan sides are neoliberalism, though the neoliberal tent does have a red line. It stops short of admitting those who favor the Handmaid’s Tale vision further up the chart.
Political Preferences are the Crooked Timber
The place to start my data exploration exercise, taken from Phase 1 of the Nationscape survey from the weeks of July 18, 2019 to December 26, 2019 to select away the ways COVID and crime spikes may have intensified social conservatism based in threat and outgroups (that’s a separate very interesting project). My purpose here is to demonstrate that the social conservatism predates either of those salient shocks, and that the character of the Eric Adams mold did not merely appear on the scene with the onset of the pandemic. They are sorted to five categories from 25 questions I arbitrary selected from the dataset, broadly into five categories: abortion, immigration, guns, environment, and social attitudes.
As I suggested by invoking the Handmaid’s Tale vision, the best place to start might be the contrast between NY-10 and WA-07 on abortion. On psychometric terms, the abortion issue is the clearest. Opinion surveys reliably indicate the lowest rate of indifferent responses, and it is extremely difficult to spark preference reversals that we’ll see are disturbingly common. There is a clear if minor difference between survey respondents who would forbid abortion in all cases, an outlier opinion in the liberal democratic West.

I don’t want to overstate the difference in the above charts. The filmmaker, Michael Moore, has a line that the 60’s hippies had an agenda, and they unambiguously won. Their dreams are now projected as our beliefs. The People of Paradox enabled by the U.S. federal structure makes it so that a committed liberal can confidently shout United States of Arabia and skeptical voices of calm can point out that U.S. abortion practices are more permissive than many European states, and both can be right.
The victory of the 60’s generation as victorious also comes out on gun issues, which are even more in their favor in the case of otherwise more conservative NYC than Seattle. As has been found many times elsewhere, around 90 percent of respondents favor background checks on gun purchases in both places. Around three in four favor the slightly more coercive measures of gun registries and bans on assault weapons. But the kicker is that in New York a majority of respondents favor the most coercive policy of them all—emulating the Japanese way of eliminating gun fatalities by making it nearly impossible to own a gun. The survey simply said “ban all guns”. That is the kind of extreme position that I wonder if it was cataloged in the social ideology score by assigning a greater weight, bringing the overall score down in line with other Democratic observations. With such overwhelming support on these issues, which extend nationally, the limited capacity of legislatures to respond is a puzzle that is not entirely explained by the intensity of opinion among concentrated and diffuse interests. If anything, David Frum reminded us, when they do respond, they respond in damaging ways aligned with conservative meta-narratives of threat. The threats they have in mind are on two fronts, the physical threat from everyday gun violence and the political threat of a shift from private interest to public action.

Reviewing the immigration statistics will shake any liberal to their core. They are in the spirit of Everybody Lies. Over one-third of New Yorkers (the home of the Verso Lofts no less!) want to build a wall on the U.S-Mexico border and deport all undocumented migrants, as Trump blustered on the campaign trail? It’s also where the preference inconsistencies begin to start with a substantial number of respondents indicating that they favor a path to citizenship for the undocumented, including but not limited to Dreamers, and in same breath to begin deporting all of them. They are inconsistencies that Trump deftly manipulated playing the chameleon, allowing independents hoping for a classic populist to latch onto “the Golden door” while delivering rotting red meat to the base.

I included environment as a social issue, because that is where my priors lie. In college, I was persuaded by this Vox article on the identarian significance of rolling coal. Likewise, I recall a LSE PhD student studying polarization standing up in Oct. 2019 on panel discussion headlined by Ed Miliband on whether sufficient care was being heeded to climate change “becoming embroiled in the culture wars”. The design principle of IRA, as outlined by Tim Sahay and Ted Fertik at Brown, is to carry out the Anglo-American agenda of levelling-up, which means in the American case to deliver carrots to political adversaries so they may become partners. In Hirschmanian fashion, to overwhelm the passions with interests. There need not be anything culturally conservative about the statement over 80 percent of respondents from NY-10 and WA-07 agreed to, “make a large-scale government investment in technology to protect the environment.” Anybody who disagrees with that statement is a Last Man who fundamentally rejects the future, Obama wrote in a statement after Trump pulled out of the Paris Agreement.
In progressive districts, the danger can just as easily go in the reverse direction. The “passions” are fully behind a carbon cap on emissions and the deployment of progressive tech to that end, but the “interests” are partially opposed. Tellingly, New York, the city where extracted fossil shareholder returns flow to, is more ambivalent on the question should oil and gas stay in the ground than their environmental bonafides would suggest relative to Seattle.

The Social Rift? Sampling Attitudes in Seattle & Brooklyn/Lower Manhattan
Even after I disaggregated the source data, I am still left perplexed by why the social ideology score is so much higher in NY-10 than WA-07. Directionally, all the responses are as expected but given that the samples2 in each district are over 300 observations and scarcely 100 observations for the set of randomized questions, the difference is often only a handful. And yet a few of the attitude questions do not require the analyst to squint to spot the difference.
Aside from the special case of school vouchers, which we might expect to be an unusual issue for New York relative to other American cities, particularly on the Left Coast, which have less propensity for suffocating opportunity by zip code, the two sharpest differences were on attitudes to the LGBT and marijuana use. Overwhelming majorities are favorable to each of those groups/issues in WA-07, while significant minorities are uncomfortable in NY-10.


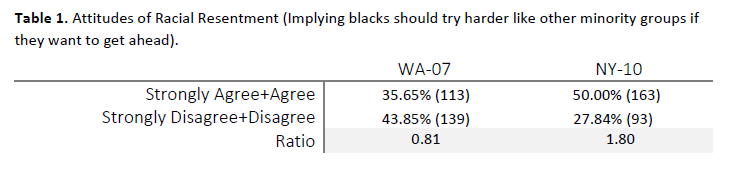
A simple explanation emerges from a glance at these issues. There are simply more ideological liberals in WA-07 than NY-10. The simple explanation is not quite so simple. I will now introduce one of the most fantastic preference reversals of all. In one corner, reparations. In the other corner, the classic Tesler marker of racial resentment, Italians, Irish, Jews, and other minorities, the melting pot of 19th century New York, all accepted the rules of the game and rose the meritocratic ladder of American opportunity without any special favors, why should we kick away the ladder for blacks?3 A statistical fact is that survey respondents do not have any special interest in political science and do not get what the question is asking, with many self-identified Get Out liberals indicating racial resentment in both NY-10 and WA-07.
Still, WA-07 is at least more sure of itself with liberals on reparations also liberal on resentment attitudes. Just as was true for environmental attitudes, when the question turns to economic dimensions4 evaluating the core myths American meritocracy, the preference reversals are far less severe. NY-10 is more like America confused as to what it believes, perhaps the reason why its politics linger in the national imagination.5 Like the blanket ban on guns, a majority of NY-10 respondents favored the most extreme position of reparations. On both issues, that is a very different set of responses with its Republican peer districts along the social ideology y-axis. I suspect that national support for these issues tops out at approximately 15%.6

I am still interested in scrutinizing the markdown of the social ideology scores if that is ever released online, but I also believe that it is not strictly necessary. In the interests of parsimony, I think it can serve us fine to solve the paradox of New York’s seemingly implausibly high social ideology scores by reducing the universe of position issues to the above table. Or you can reduce it to this single data point I saw on Twitter yesterday, representative of the classic out-group purity conservatism unusual for the highly educated I am seeking to explain.
The Genealogy and Evolution of the Crooked Timber
I am also very curious to trace the legacy of the counterculture on the Left Coast by adding a statement variable which might be called affinity for counterculture mores. The types of questions I have in mind for the Nationscape survey are in the spirit of the observation Tooze shared on Top Links this week. Tooze, like his fellow New Yorkers, recoils at the thought of composting loved ones as reminiscent of Sweeney Todd. And yet, there is a market for that service in Seattle:

There is a long tradition of both historical writing and common stereotypes that distinguishes the frontier spirit in the West from the established roots in the East, a regional divide that remains in spite of the increasing salience of urban/rural divides as the organizing principle of American political life, the Iron Law of Density. The counterculture strain says: resist that instinct which recoils as a Nietzschean slave morality and dare to invent the future of morality. They shout exercise faith that we are the vanguard leaders, and the unbelieving herds will soon follow. They insist their beliefs will be widely, if as this analysis has underscored not perfectly, accepted 50 years hence. Depending on where you stand —to the right or left of the King—the crooked timber evolves as a result of their efforts to meet urgent environmental conditions or maladapts from their intrusions which disrupt the “natural” ecology.

I had the opportunity to attend a small talk organized by a friend with Ossoff at Emory in 2018. A very nice man, also with an affiliation to the LSE.
Which are not random by the way, the authors clarify in their user guide.
The exact wording of the statement from the Nationscape codebook is, “Irish, Italians, Jewish and many other minorities overcame prejudice and worked their way up. Blacks should do the same without any special favors.”
There is another similarity with environmental issues. Both reparations and cap on carbon emissions have an implicit economic dimension, but the responses suggest that respondents do not have these tradeoffs in mind when prompted, instead articulating statements of identity. I suspect that if you make these tradeoffs explicit, the favorability rates would plummet in a pattern that is similar to Medicare-for-All polling.
Can you name the mayor of Houston?
Reparations is among the randomized questions, with very small sample sizes agreeing to respond <80, so note that my conclusions here are only indicative with language stronger than the data supports.