Is this what it looks like when the gears shift?
Part II: Concern about Global Broiling
“I cannot be content with a brief moment of riotous living followed by destitution. However clever the scientists may be, there are some things that they cannot be expected to achieve…It would be irrational to hope that the present heyday of industrialism will not develop far beyond its present level…the capacity to supply human needs will diminish, not suddenly, but gradually. This could, of course, be prevented…a question of politics [but I digress…].”
“I like mathematics because it is not human and has nothing particular to do with this planet….– because, like Spinoza's God, it won't love us in return.”
~Bertrand Russell
“Summer will come to mean something different—not the carefree season anymore, but a time to grit one’s teeth and survive,” Bill McKibben in The End of Nature (1989).
“The real trouble of this world of ours is not that it is an unreasonable world, nor even that it is a reasonable one. The commonest kind of trouble is that it is nearly reasonable, but not quite. Life is not an illogicality; yet it is a trap for logicians. It looks just a little more mathematical and regular than it is: its exactitude is obvious, but its inexactitude is hidden; its wildness lies in wait,” G.K. Chesterton.
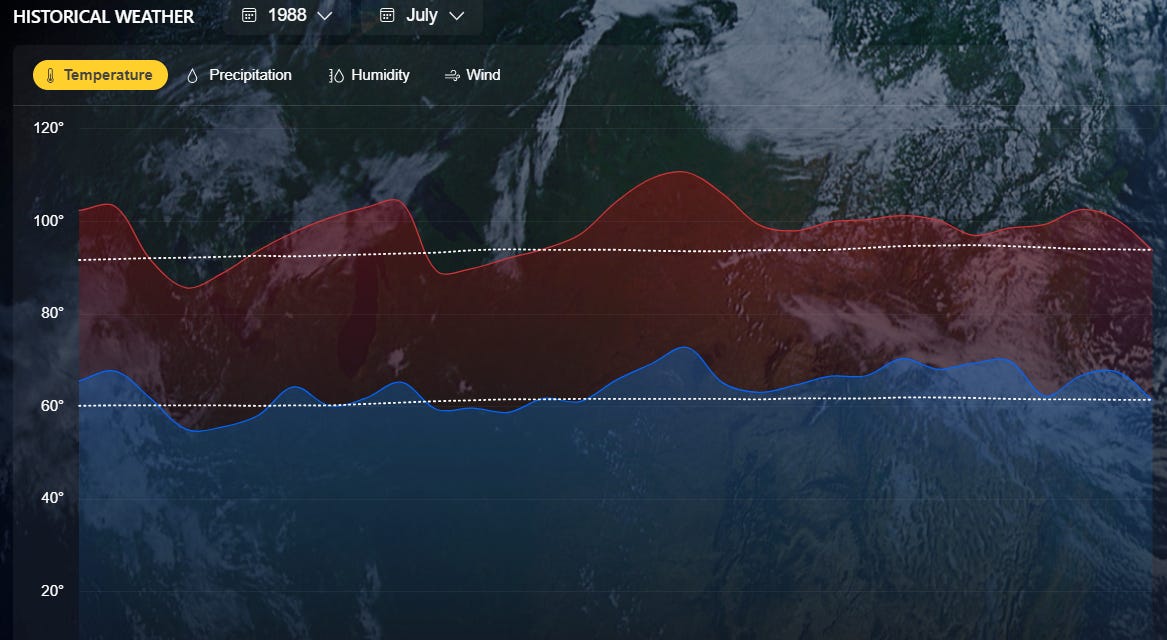
At the end of this July as my little AC unit failed to keep up with the sweltering heat, I had a burning curiosity staring at this chart:
Did I just live through the hottest day summer in recent memory, the future Bill McKibben predicted —a second nature where one can only grind one’s teeth and survive? Interestingly, the summer that my parents point to from memory as especially hot happens to be the year before McKibben’s book, The End of Nature, was published. See if you can spot the difference:
Yes, it was above the historical norm nearly the entire month, hovering around 100 for an extended stretch, but with the exception of a single three-day stretch, you do not observe significant deviations above the norm for extended duration.
Science begins with observation. I thought to myself there has to be a way to formalize the patterns I am detecting. Let’s bring one simple mathematical abstraction vital to climate communication, the area under the curve, and machine assistance to systematize the relationship. I decided to take those measurements for two peak summer months from the MSN API for 71 cities around the world. The results are interesting for reasons that I hope to adequately describe in the following sections, but chiefly the warming I observe in the location which I happen to reside is, the sweltering sensation notwithstanding, actually rather modest and typical. Hardly one thousand degrees Farenheit of cumulative warming during peak summer months (July-August) from the threshold year I identify—defined as the year temperature highs shift from typically below the dotted line to one that is typically above—of 1987. But that warming—and again, this is typical—is contained almost entirely (80% and above) to the Great Acceleration, defined arbitrarily as the 15 year period after 2009.
Exceptions exist for both trends, threshold years during the Great Acceleration rather than well before and warming that does not follow a hockey stick for the period analyzed. There are certain places which already observed significant warming as Roger Revelle was typing up the very first formal findings on the “chain of effects” which would result from even one degree or two of warming above the preindustrial average. Then, the warming came in other places as we added the 20% CO2 concentration the UN forecasted in 1955 would occur by 2000. In still other places, the threshold, this year’s theme of Noema, came when ignoring the warnings continued to add another 20 percent in the 21st century, sailing past 420 ppm. The variance I observe in one two-month period within every year is greater than the variance officially viewed by scientists, where warming is typically 1 degree Celsius above the preindustial average of extremely hot cities near the equator and as high as 2.3 degrees for cities nearest to the poles. My variance ranges as much as 4000 cumulative Fahrenheit degrees of warming to no discernible warming at all.
That observation, I suspect, is quickly becoming an artifact of the geological record. For me, the convergence is a term most frequently in economic theory, but the most provocative display perhaps relates to climatic system. Indeed, I feel that a significant fact about passing 1.5 degrees of warming is that all of the relative havens I observed in the initial years of my periodization disappeared, gradually then suddenly.1 The hanging question is whether these regions continue on their asynchronous timelines, which would suggest a gradual ramp up before the true ascent up the exponential hockey stick proceeds, or whether they immediately join The Great Acceleration standard type. The balance of evidence suggests the atypical type might observe a discontinuous jump toward convergence with the rest of us. But the dark forces of time and ignorance currently overwhelm an accurate judgment on what single observations like Chengdu’s 2022 represent under Gaia’s preceptoral vision.
In any case, the mantra on the Economist’s 2021 cover, 3 degree future—no safe place, ought to never be doubted. Continue to accelerate what I call in the analysis that follows, the post-1989 Capitalocene, and no stone will be unturned by climatic entropy and no amount of technological enlightenment will be able to reverse that entropy.
The Wildness Lies in the Wait (The Pre-Capitalocene 1960-89)
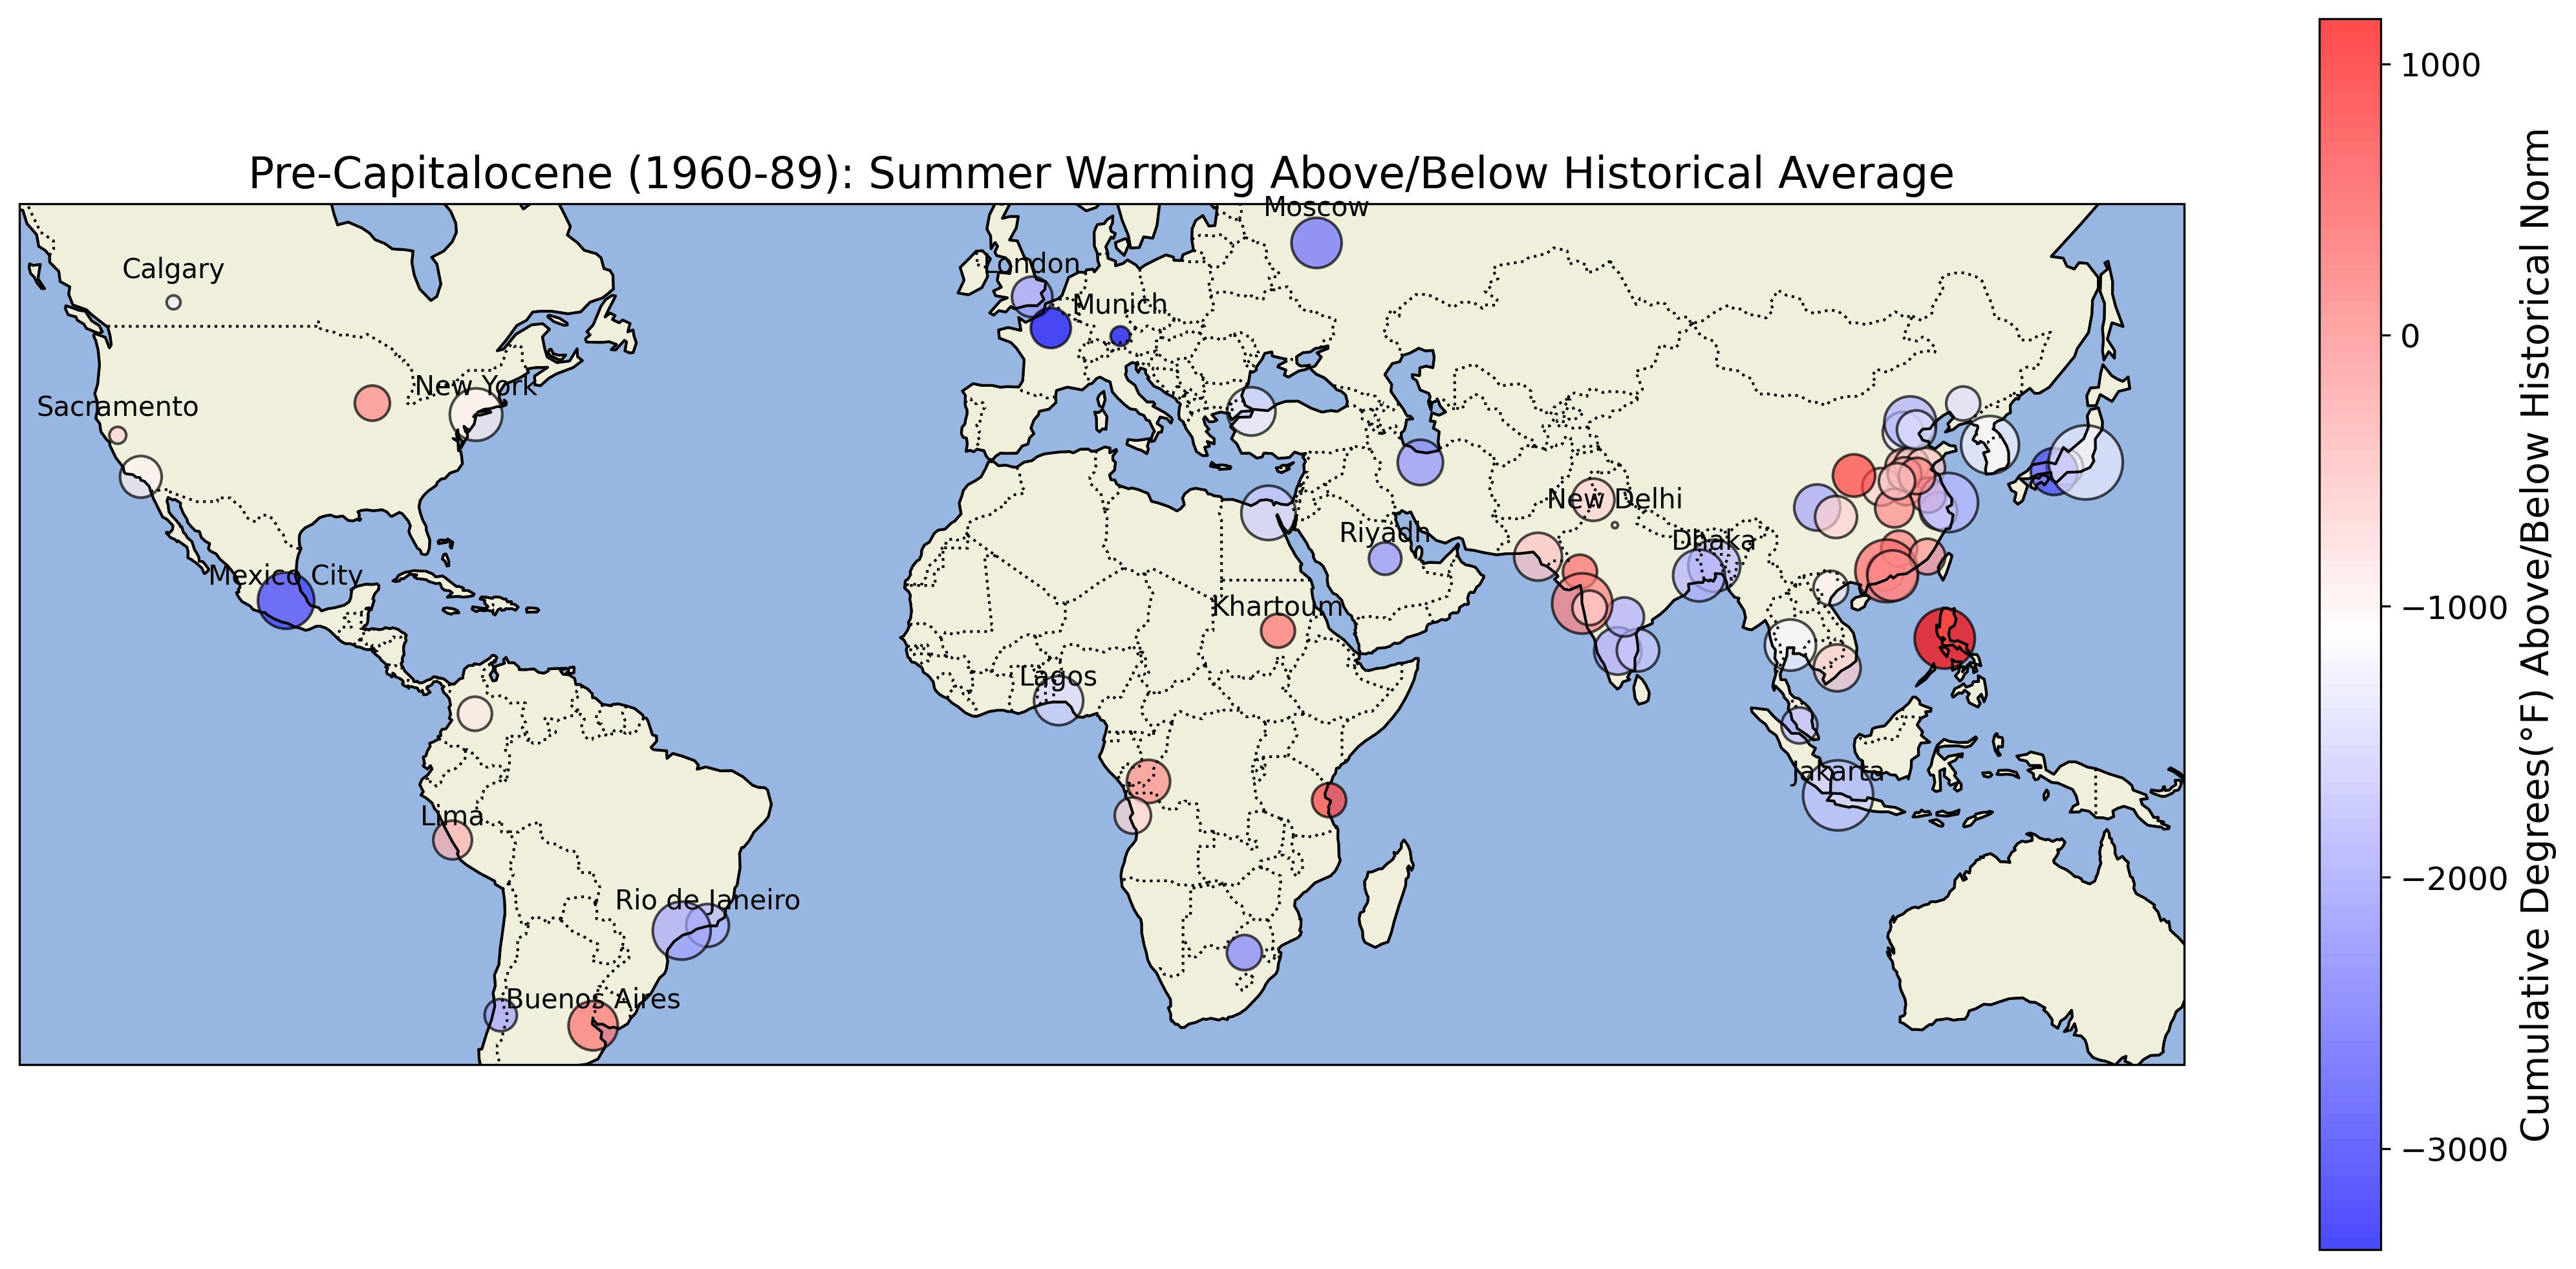
Let’s begin with what the world looked like at the start of my periodization in the pre-Capitalocene (1960-89). All values are in cumulative warming above the historical norm in Fahrenheit. As you can see, for the standard case warming will be below trend, especially at northern latitudes, and hence blue on the chart. In the post-Capitalocene charts, these standard type observations will have symmetrically red values of warming. The size of the circles are 2024 populations.
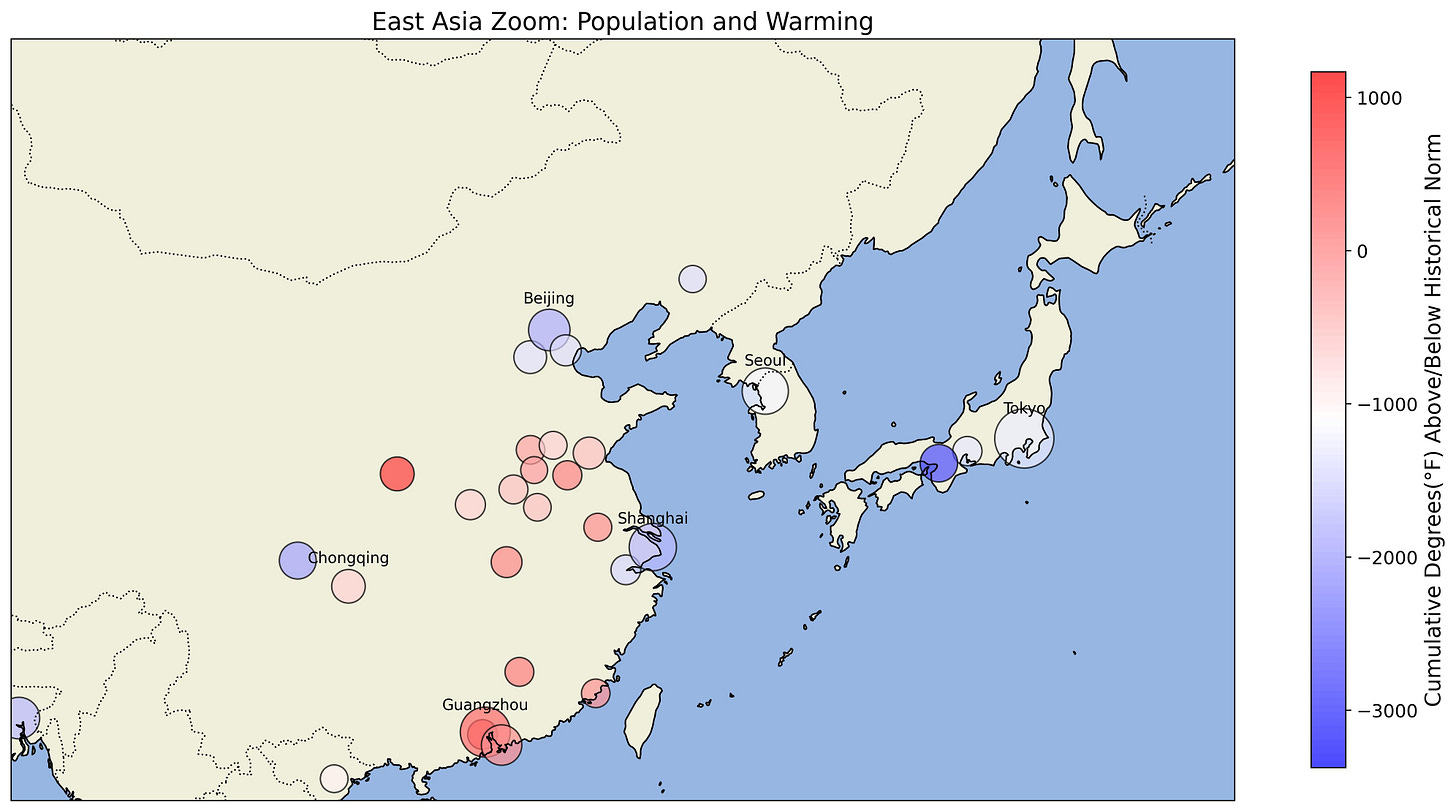
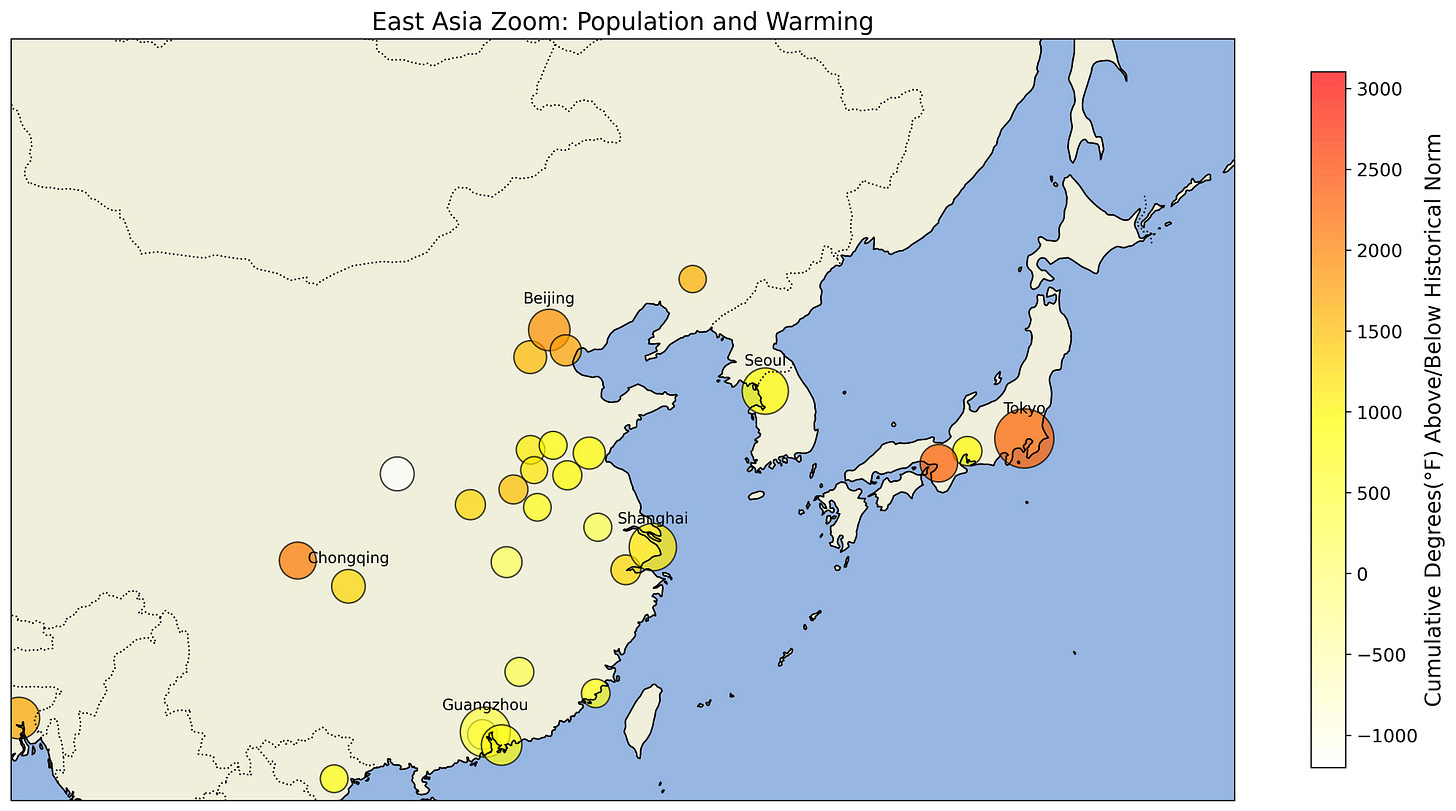
Though, equally salient is not all regions are particularly blue. Cities like Khartoum and Manila already observed modest warming above the historical norm, though it is still significant that even in these cases warming is around zero. For our purposes, another interesting set of observations can be parsed from the East Asian zoom:
Look at that collection red observations in central China! Take note as these are the atypical observations we will revisit later. From a narrative standpoint, it’s equally interesting to note that the reason why many of these observations appear as red is because of a single anomalous year which is an equally salient historical marker, the start of the Cultural Revolution in 1966. Zhoukou in Henan province registered 455 degrees above normal warming in 1966. In spite of recent consecutive years of extreme warming (~300), it still has not passed this amount. Much ink has been spilled on the question whether it is men or nature who make circumstances. In many respects, these values registered in the mid-60’s in Central China were a warning from the future of what was to come to North Africa, the Middle East, and the Indian subcontinent over 50 years later. The physiological stress of heat, on men and the natural systems they depend on for sustenance, seem to engender the psychological affliction of madness, with downstream repercussions on social order.
Netflix’s Three Body Problem, the popular adaption of the complexity message, opens at precisely this moment for reasons that relate beyond the nationality of the original author. The shadow history of the 1960’s, when men2 began to tinker with machines which would transform the nature of rationality to a collective sensemaking function, was the precise moment the future was forged.
The future is here, but unevenly distributed (The Post-Capitalocene 1990-2024)
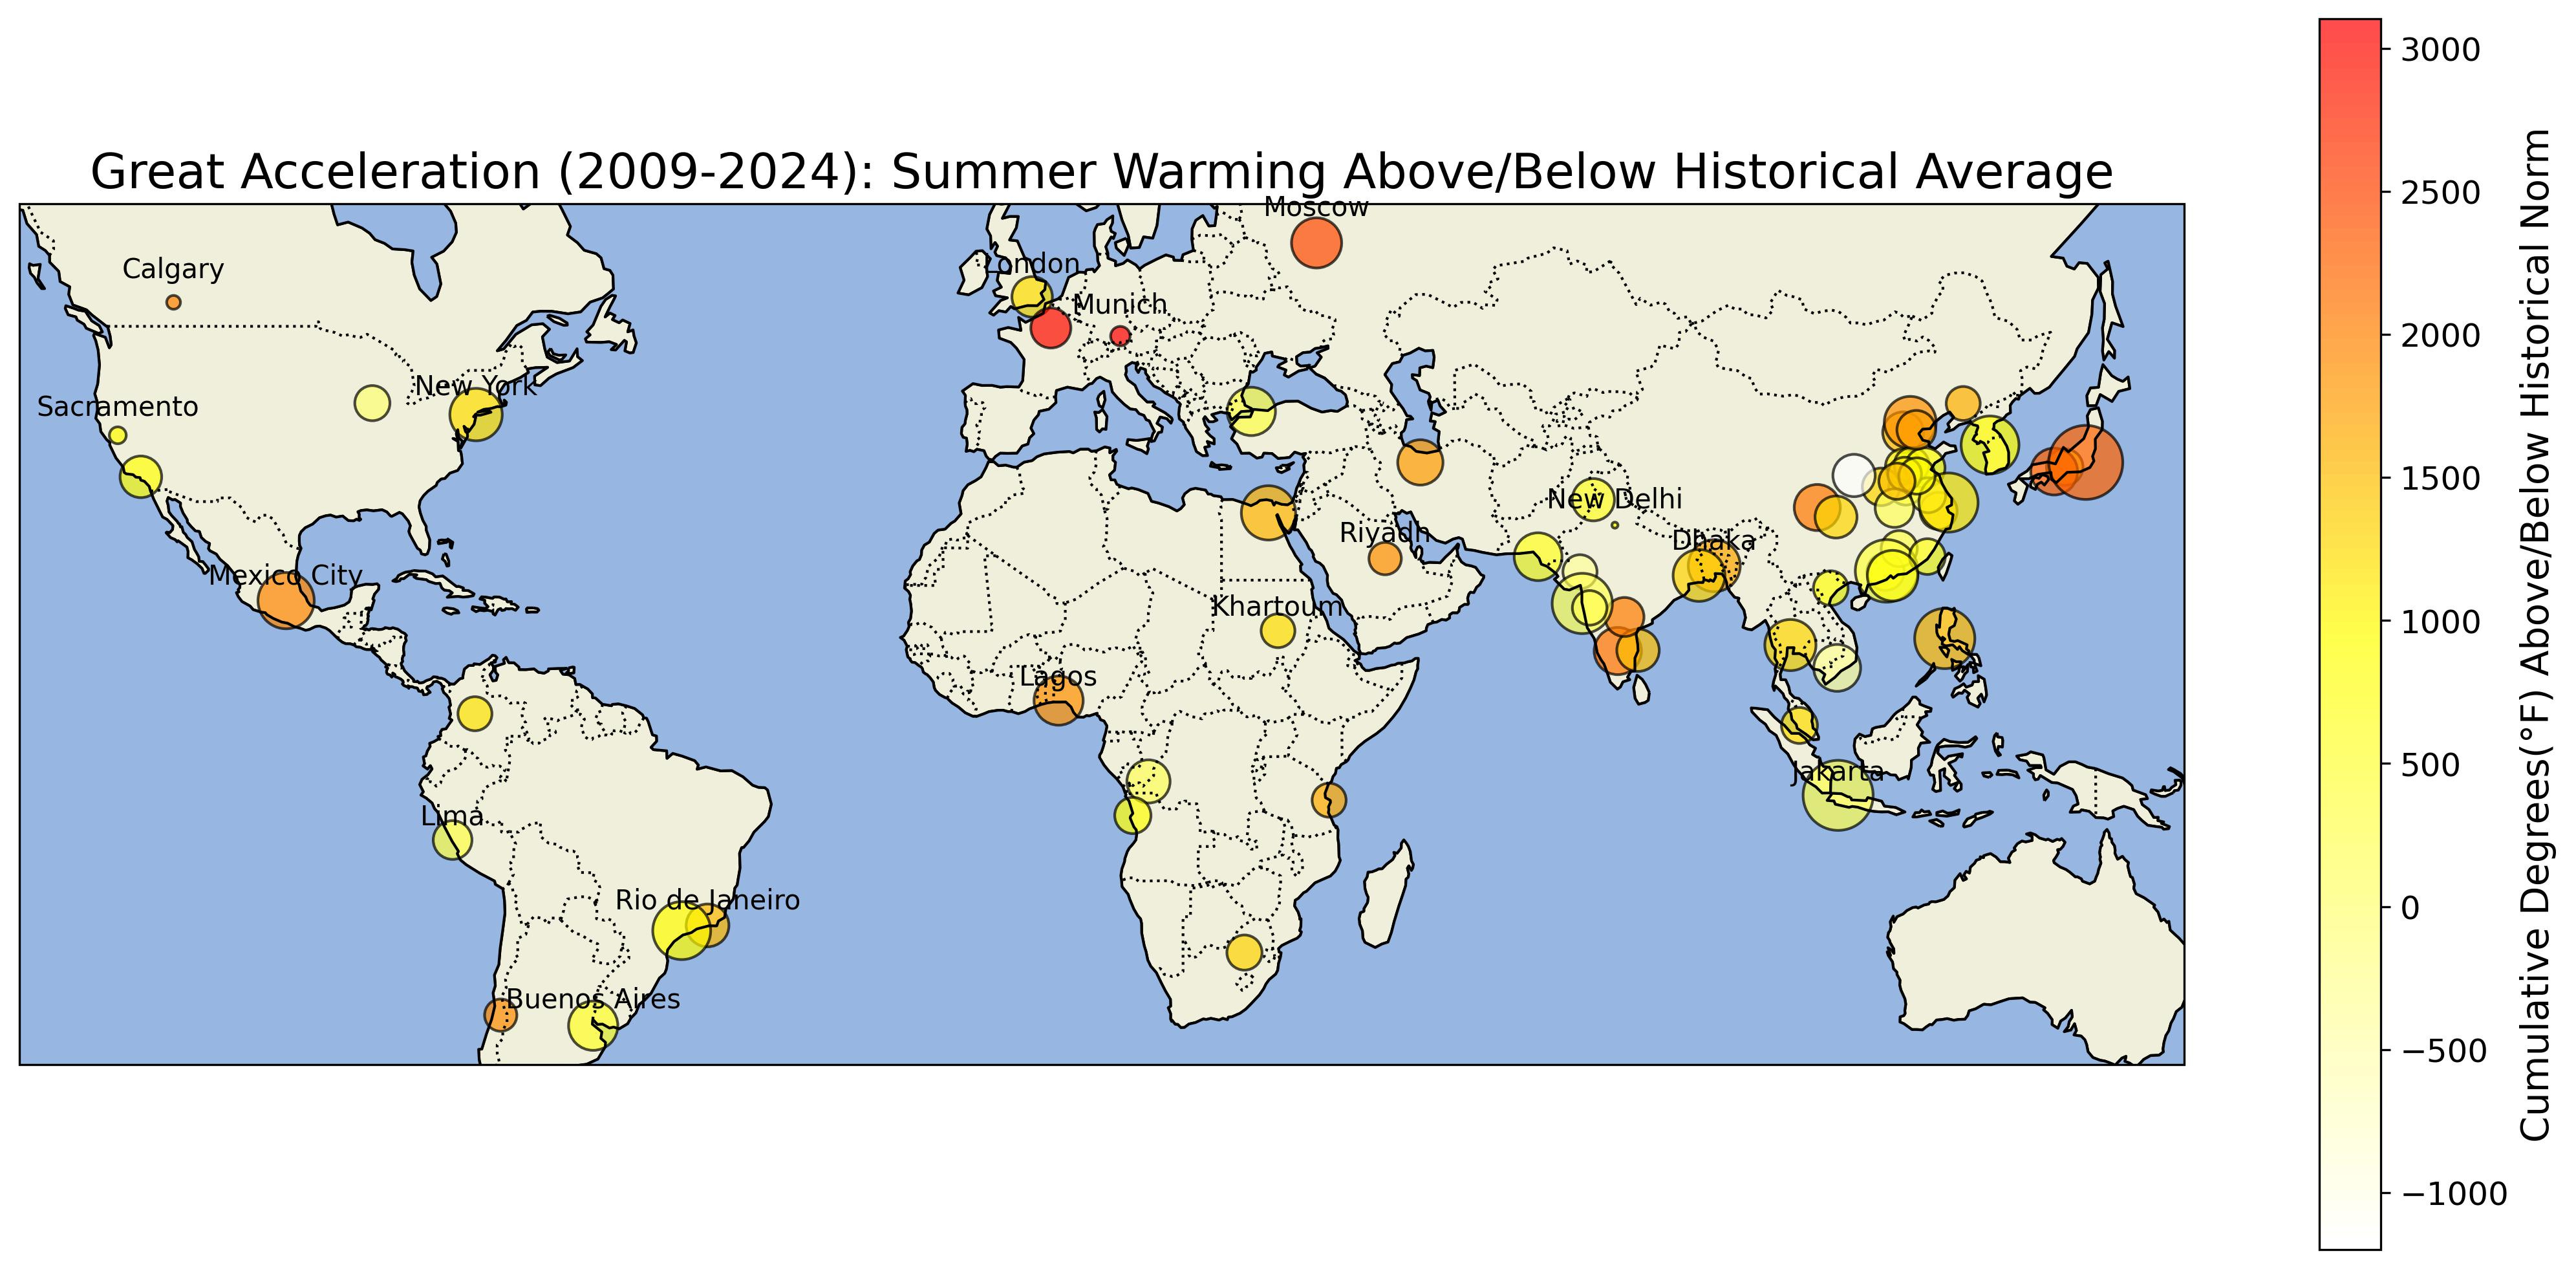
During the post-capitalocene after 1990, roughly the future Roger Revelle speculated on in 1956, almost all the circles darken and the negative values disappear:
By and large, cities in northern latitudes, the Middle East, and Southern India are the cities where the most warming occurred, precisely the cities which were the most negative in prior map. If any hard deniers have ventured this far, we reject the null, observing a significant difference between the two periods.
Though it remains a conspicuous fact that the future of Revelle’s telepathy was unevenly distributed. The cumulative warming values of central China in this period are strikingly similar to the previous period.
Consistent with what I wrote in the introduction, it would appear from this glance at the data that thresholds, where any additional warming is adding to the bathtub as the preindustrial warming allowance has been used up occur asynchronously. In the standard type, that threshold is within ten years of the arbitrary Capitalocene marker. On each end, there are the atypical types where the threshold was observed very early and very late. The relationship is when warming above expected shifts from typically negative to typically positive.
To tease out this relationship, it is only necessary to write another script. “GPT-4, find me the year where the cumulative warming before is as near as possible to the negative of the cumulative warming after?”
And all the significant warming types that have occurred in the Global South standard types, chiefly Middle East, Khartoum, Dar es Salaam, Manilla, Dhaka, and Southern India, have values that do not follow the standard pattern.
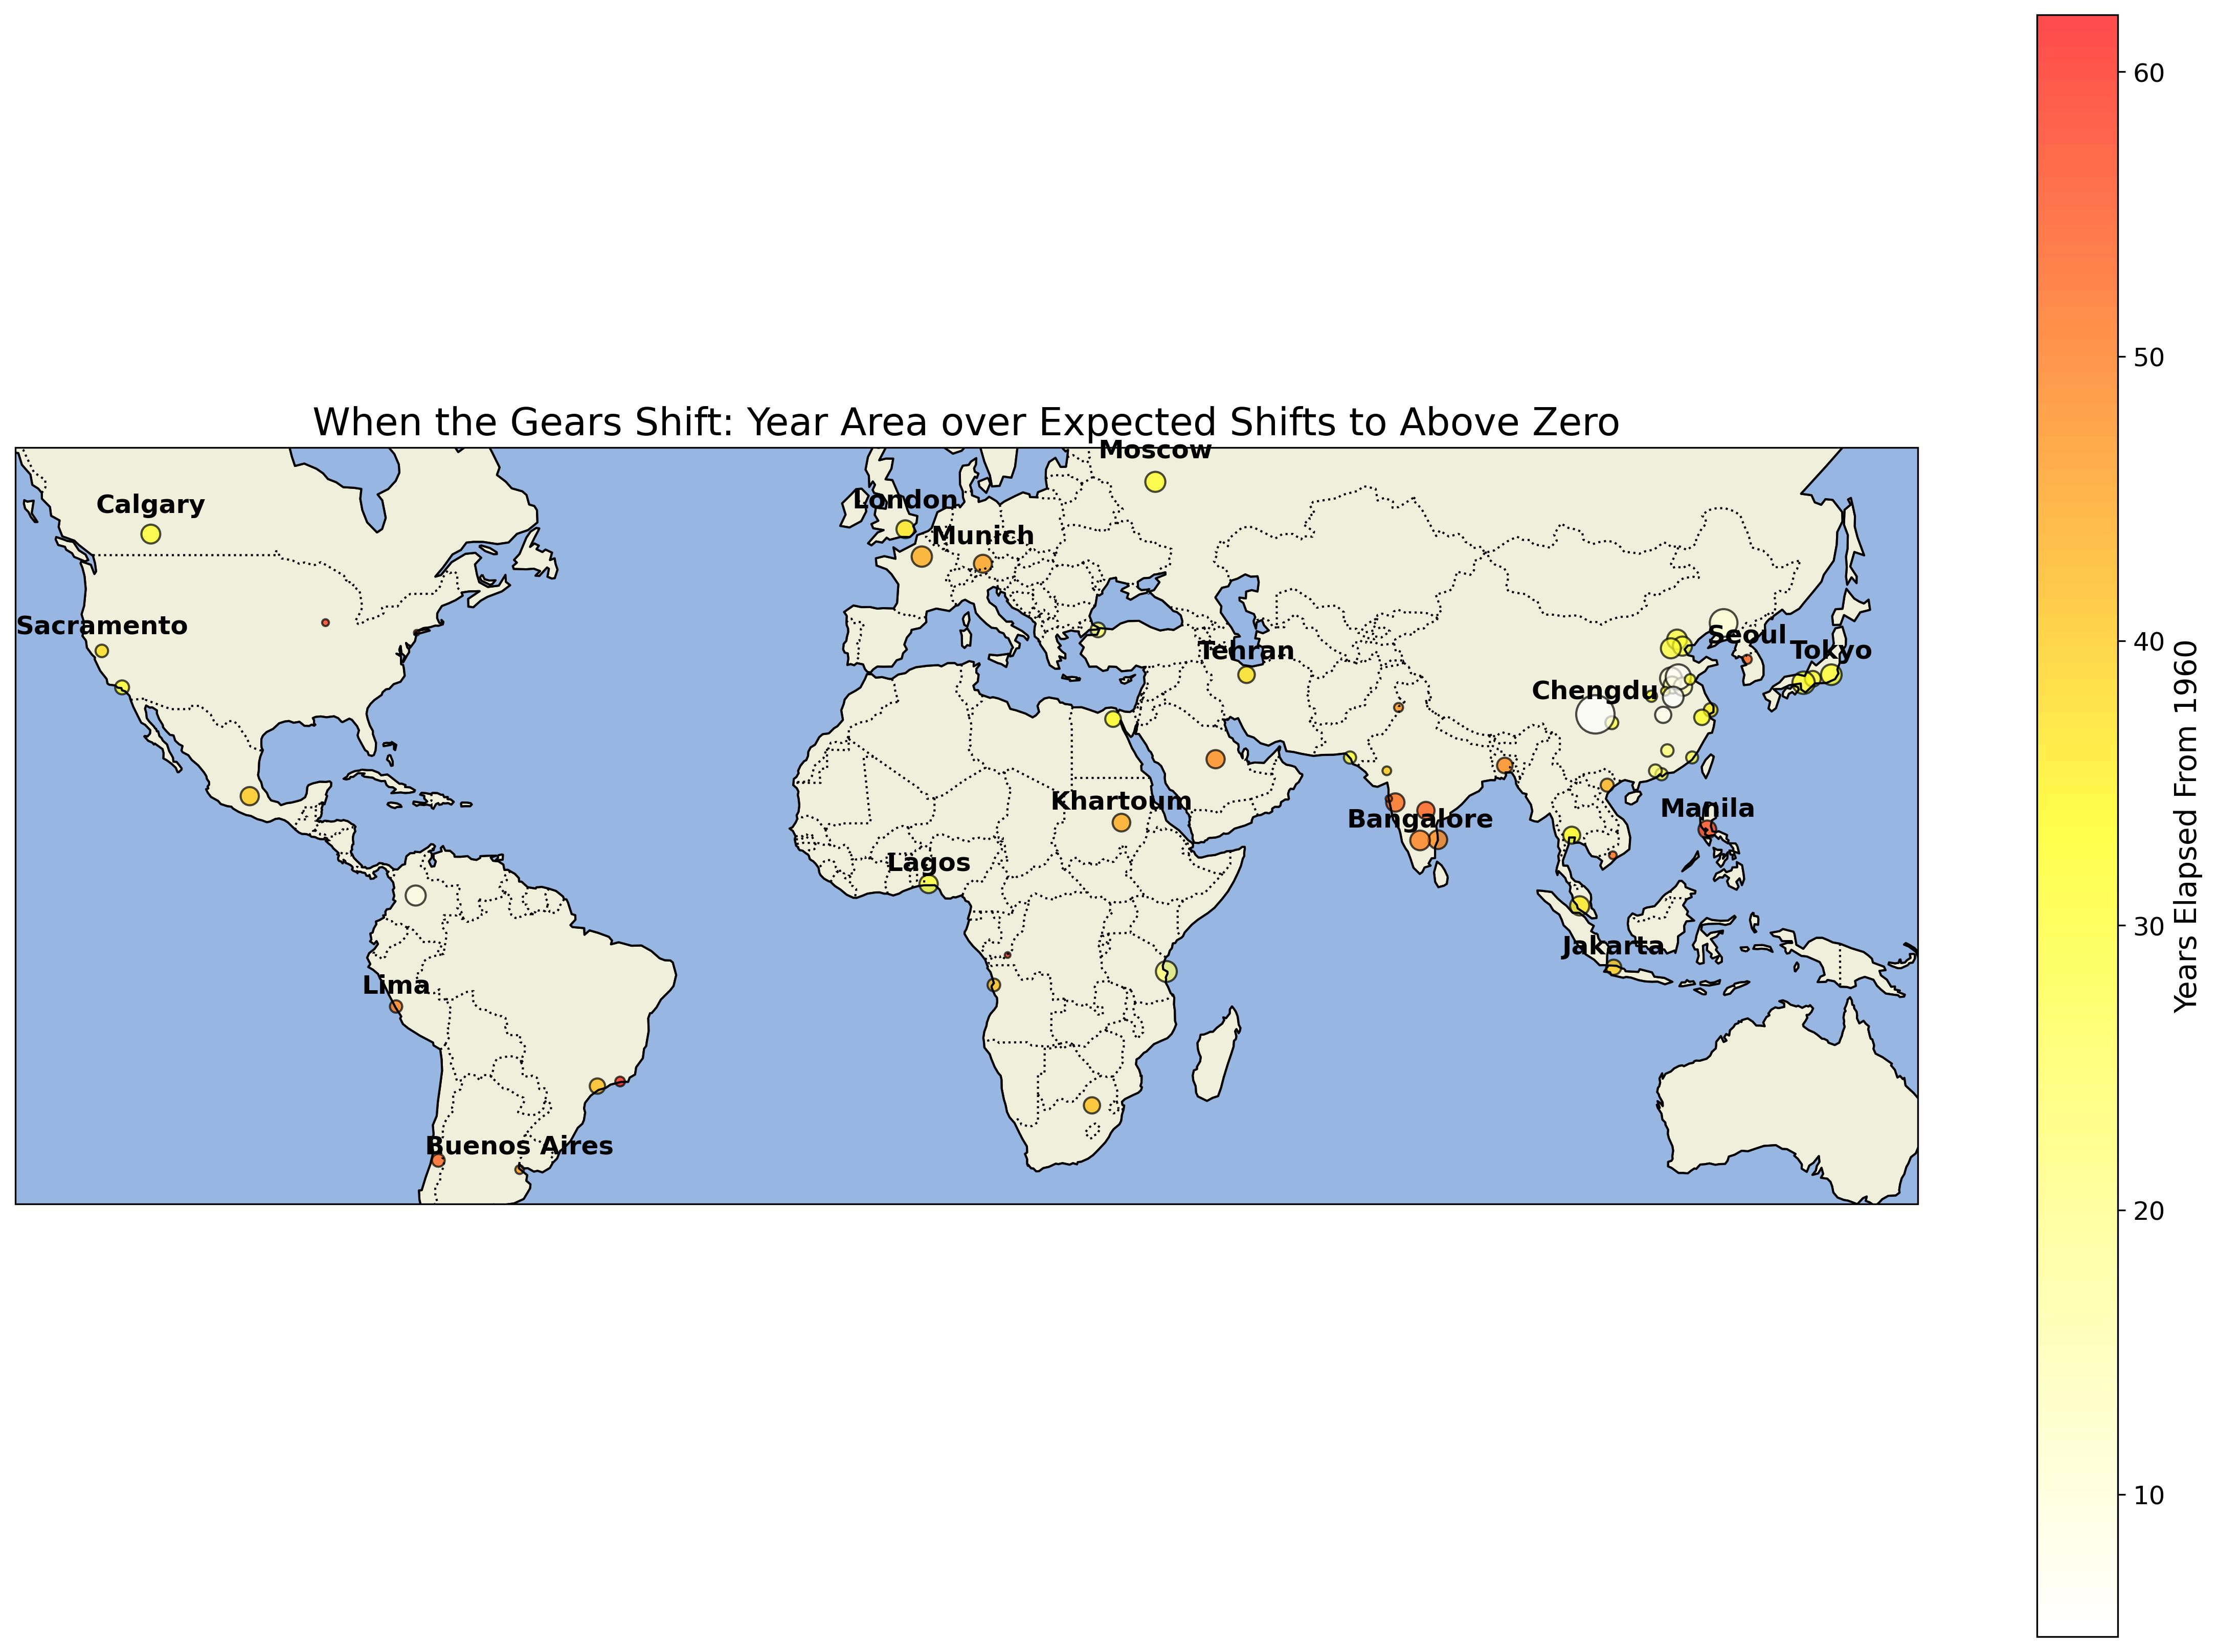
Visually, the tables look like this. The size of the circles represent the average warming per year after the threshold year. The color represents the threshold year. Any colors darker than yellow mean that the threshold occurred well before 1989. Any white colors indicate more recent thresholds.
Notice the cluster of Chinese cities in white. The largest circle, Chengdu, was already emphasized as experiencing surreal unheimlich where the warming 20 degrees Farenheit above normal for an entire month led to significant stress on the grid.
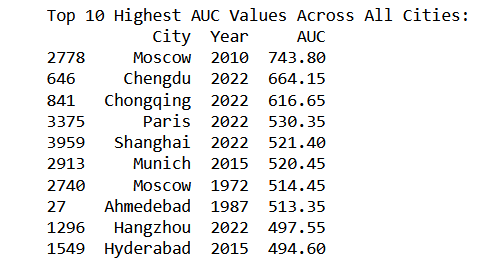
And the hanging question still applies now that is presented with more concreteness. In spite of central China displaying little warming until the mid-2010’s, now markers of crisis are flashing red to Latour’s newspaper-reading Moderns— will the size of the circles persist rejoining the Great Acceleration cities after a period of inexplicable divergence? In practice, that would imply future extreme values will be Chinese, which has generally not been true in the past3:
A Trap for Logicians (The Great Acceleration 2009-24)
It should be emphasized just how disruptive each of those top 10 extreme values are. Russia’s 2010 was, from where I sit in California, a familiar yet extreme polycrisis nexus where temperatures contributed to drought, which fed into fires, which fed into pollution, which fed into excess deaths which were at least 50% greater than the year prior in Moscow. The previous drought of similar scale was roughly 40 years prior, also on the list. The list of negative feedback for Gujarat in 1987 is just as harrowing: “The worst drought in a century…[food production reduced by as much as 75%]…36 dams completely dried up….[reducing capacity by 95%]…sugar factories close rendering [500,000] jobless….acute shortage of drinking water.”
Even in a world frozen shut at our current CO2 concentration, we would expect significantly more of these outliers, as the litany of 2022 observations suggested by five of 10 being in a single year (2022) and eight of 10 falling in the Great Acceleration. Here are the 30 cities where over 75 percent of cumulative summer warming above historical average after 1989 occurred during the Great Acceleration. These cases are consistent with acceleration as increasing the rate of warming per unit of carbon:
The top of the list is dominated by the Chinese cities identified in the prior section where the gears have shifted recently. In those cases that exceed 100%, if it were not for the warming that happened in the 2010’s, the post-1989 values would be under the historical norm, cumulative values below zero. Notice the extremely high value for Munich. Paris, and I presume other European cities, are all similar. Even in July it is not normal for Olympic volleyball players to simulate summer sweating of their Californian counterparts.
I quoted Chesterton at the beginning for a reason as not all cases fit this neat pattern. London is among the cases which supports a constant return to scale while some others support even decreasing returns to scale. Pune and Jakarta are two observations which are particularly striking. This world of ours is a trap for logicians. Do not let these observations negate the greater number of observations which fit the explanation. New Delhi’s modest value post-2009 is worth singling out again because only modest warming is needed before a majority days are unworkable for day laborers during these months, cutting off a source of income in a manner that is similar to the other node of polycrisis, Modi’s total lockdowns in 2020:
Visually, the values presented above look like this:
Two things appear to be occurring. As I noted in the introduction, we observe the climatic analogue to unconditional convergence. No matter the regional idiosyncrasies, so long as the flow of carbon is unabated, the asynchronous timelines between cities, particularly the Chinese exception, disappear. Moreover, given that rate of change, it is reasonable to expect increasing returns with respect to warming such that Great Acceleration is appropriate as an epochal marker.
The epochal marker does not hold uniformly. Contrast central China and southern India where warming occurred very late and early, respectively. China is a clear case of accelerating peak temperatures, with only a few holdouts like Xi’an. India is the reverse case. It has a few places like New Delhi which disturbingly appear to be just ascending the hockey stick, but there is a faint hope that elsewhere because warming has already occurred to a sweltering degree the hockey stick may be pointed in the reverse direction.
On the other hand, it would probably be wise to not read too much into these reams of numbers and reference Bertrand Russell on the dangers of “facile optimism”.
Respect the Unstable
French mathematician Rene Thom’s catastrophe theory is enlightening with respect to the converging-divergence I observe and have difficulty condensing the numbers into words:
“When the domain is not sufficiently polarized…we get what I call a generalized catastrophe…characterized by a very complicated topology involving ramifying domains into smaller and smaller pieces…appear as a rule in all symmetry-breaking processes, and they are in general structurally unstable.”
In spite of my best attempt to step beyond the immediacy I see and experience, I have difficulty describing the totalizing ecology, the tendency to paradoxically break into smaller and smaller descriptive types as convergence commences. When We Cease to Understand the World, experts who train their senses to understand signals which suddenly stop making sense applies in equal measure to the climatic system as the particle scientists of the 3 Body Problem. Symmetry-breaking processes induce a triple threshold, unexplainability, unengineerability, and ungovernability. A semi-viral4 YouTube video has found an audience wider than Gunter Stein would have ever expected for this reason, delivered in 1989 as capitalism’s second nature would cascade:
The tweet commentary attached to his old school slide projection is that between panel 2 and 3, the triple threshold rears its ugly head: “just a hair bigger than that and diverging, control system will try like crazy to keep up but just can't do.” Stein is a valuable combination, an engineer who excels in philosophy. He started his presentation by instructing his conference colleagues, trained with an engineering sensibility that with enough formal mathematics any problem is solvable, on the limits of cleverness. You do not want difficult problems, he instructs, because no matter how clever, the solution is lousy.
We are staring down at precisely this kind of unaccountability machine. Formal mathematics will not even be useful, to say nothing of beautiful, when we move from the climatic equivalent of panel 2 to 3. At panel 3, a number of policy specialists rise up to pretend as if control is still possible. They are the ship commander in the Swedish film Aniara, projecting confidence as if the ship of the state is not floating aimlessly in deep space. Thinking-feeling models of enlightened rationality, the analogue to the ship’s AI, break down from the dissonance. Difficult problems, not simply that which must expend effort but where the effort expended does not produce requisite symmetry, are simply stress inducing. They are the kind of decerebrate organizational dysfunctions which compel the production of the kinds of accountability sinks found on Aniara and driving the present world mad, Davies writes.
Interpreting Stein’s words expansively, why is it that, like the Chernobyl engineers, that humanity has built this capitalist behemoth which requires manual controls in sequence? Were the distributed designers even aware of most basic principles of control theory, redundantly reliable socio-political hardware so men do not need to be angels? There certainly is no evidence of intentionality if they were aware, Stein may have inveighed. “We are complacent if we to pretend that [these issues of control theory I have outlined in detail today] do not apply in the West.” 35 years following the collapse of the Soviet Union, Stein could not have known that the time between the contemporaneous epochal climate conferences sounding the alarm and the present would be spent about as well as that separating the death of Stalin and collapse. Building a ruin.
That is not to say collapse is imminent; I think it must be emphasized that fortunate regions of the world are squarely in panel 2. To be sure, a shame so much time was wasted when the solutions were truly easy off the projector in panel 1. But doubt can emphatically motivate action. Though the time is so near expiring—”just a hair more”— that in effect we are like the ship travelers on panel 3 with every leap in time engendering a desperate fear which reveals what the sharpest on the ship knew all along. No plan exists except to march to what Thom ominously prophesized:
“the final state of catastrophy [in spite of its structural instability] may very well be determined”.

With the anomaly of Xi’an and few other Chinese cities like Guangzhou where the shift in warming has been so recent it is impossible to discern for the summer warming observed whether it is one or two anomalous years or whether it represents a trend.
Almost wholly men, though not in the Netflix adaption for reasons that relate to Mao’s progressiveness on gender issues “women hold up half the sky”.
The historical force of the Great Proletarian Cultural Revolution notwithstanding.
That is, for a video laden with blabber about bode integrals and never intended for anybody but a narrow community of control engineers.


